Reading YouTube audience retention key moments — intro, top moments, spikes and dips, and comparing viewer segments (November 2026)
Shortsmith team · Updated
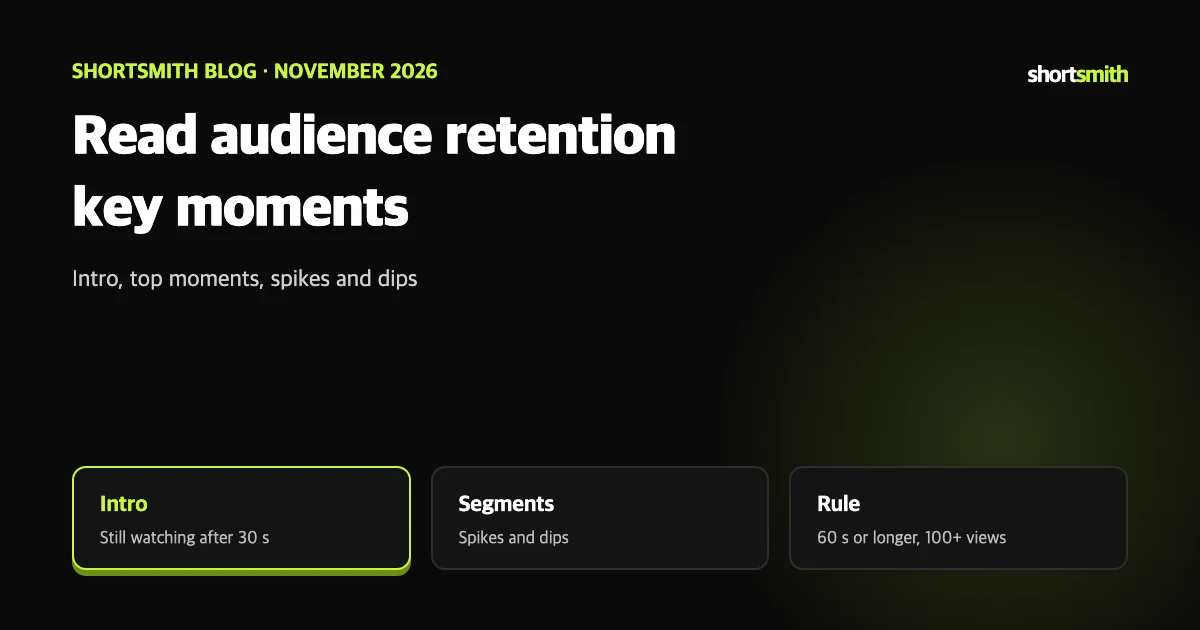
Two videos can have similar views while one is watched to the end and the other is left within seconds. To see why, read the shape of the graph. The “Key moments for audience retention” report in YouTube Analytics shows how well each part of a video holds attention.
This post summarizes YouTube Help’s “Measure key moments for audience retention” as read on November 10, 2026. The report appears only for videos that are at least 60 seconds long with at least 100 views, so it does not apply to short Shorts.
Where to find it
Retention data usually takes 1 to 2 days to process, so an empty graph right after upload is normal. The report is available only at the video level of YouTube Analytics.
- Sign in to YouTube Studio.
- Choose Content in the left menu.
- Select Analytics on the video you want to check.
- On the Overview or Engagement tab, find the audience retention report and click See more to compare against all YouTube videos of similar length.
- Use the Segment drop-down to pick a viewer group and see its shape.
What the graph shape means
A decline is normal. The problem is a dip that is unusually steep compared with other parts. The help page’s way of reading it is to look for parts that stand out from the average. With typical audience retention you can also compare against your 10 most recent videos of similar length.
| Shape | Meaning |
|---|---|
| Flat line | Viewers watch that part from start to finish |
| Gradual decline | Viewers lose interest over time, which is typical on YouTube |
| Spike | Many viewers watched, rewatched or shared that part |
| Dip | Viewers stopped watching or skipped that part |
The four segments the report highlights
A high intro rate means the first 30 seconds match what viewers expected from the thumbnail and title and keep their interest. If it is low, suspect a mismatch between the promise (thumbnail and title) and the content before blaming the video itself.
Not every video has all four segments; only detected ones are highlighted. The video must be 60 seconds or longer with 100 or more views.
| Segment | Definition | Recommended improvement |
|---|---|---|
| Intro | Share of viewers still watching after the first 30 seconds | Change the thumbnail and title to reflect the content better; rework the first 30 seconds and try different styles |
| Top moments | Parts where very few viewers leave | If they are late, move the engaging content earlier; expand that content into new videos |
| Spikes | Parts viewers rewatched or shared | Find out why; viewers may have rewatched because the content was unclear |
| Dips | Parts viewers skipped or stopped at | Review why they lost interest compared with the part before |
Compare by viewer segment
Some data may need advanced mode to be turned on. If subscribers and non-subscribers show very different graphs, you can use that to decide whether an opening tuned for subscribers or for first-time viewers is the goal of the current video.
| Comparison | Description |
|---|---|
| Organic and paid traffic | Organic views come from viewers’ direct actions such as searching, clicking a suggested video or browsing a channel. Paid views come from paid placements (skippable video ads and display ads) |
| New and returning viewers | New viewers watched your channel for the first time in the period; returning viewers watched before and came back |
| Subscribers and non-subscribers | Viewers who subscribe to your channel versus those who watch without subscribing |
Detailed activity report and terms
The page’s point is to use data on when viewers start and stop watching to improve your content.
- Detailed activity report: shows absolute views for each segment of the video, and how many viewers started and stopped watching at different points.
- A segment’s absolute views can exceed the video’s total views, because the same viewer can watch part of the content several times in one view.
- Average view duration: average minutes watched by viewers who kept watching, based on engaged views and their watch time.
- Watch time (hours): the total time viewers spent watching your video.
Shortsmith’s performance screen, used alongside
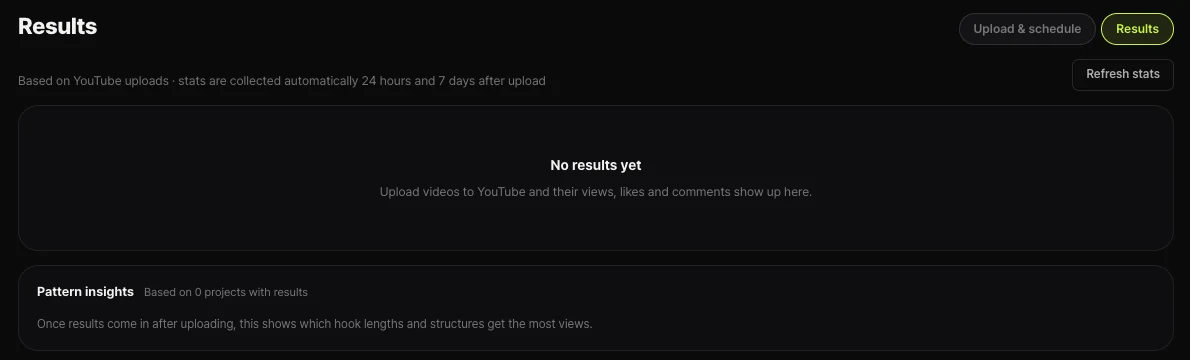
Shortsmith’s Upload and Performance tab collects views, likes and comments for videos you uploaded to YouTube, and gathers statistics automatically 24 hours and 7 days after upload. Once results exist, a pattern insights box shows which hook lengths and structures get more views. This describes the screen as of November 2026; it does not replace the retention graph in Studio.
A sensible order: after uploading with Shortsmith, watch view trends in the Performance tab; for videos 60 seconds or longer with over 100 views, check the intro and dips in Studio Analytics. Reflect dips in your next script by cutting or shortening those scenes. Videos under 60 seconds such as Shorts do not get this report, so use the Shorts analytics help for their metrics.
Summary
The order to check when you open the report.
- Confirm the video is 60 seconds or longer with 100 or more views.
- Wait 1 to 2 days after upload for data to process.
- If the intro rate is low, match the thumbnail and title to the first seconds.
- If top moments are late, pull them earlier.
- Find out why spikes happen and why viewers lost interest at dips.
- Split by segment: subscribers, new viewers and paid viewers.
How to check whether the help pages have changed
YouTube Help updates its documents whenever a feature changes, and translations lag by language, so the Korean and English versions can differ slightly. The figures and conditions here come from pages read on November 10, 2026 and may have changed since.
Before making an important decision, open the original links under Sources and compare them with what you see now. Eligibility rules and numbers change most often. If a menu name looks different, look for a similar item in the same place; if it is missing, the feature may not be enabled for your account yet. Statements about Shortsmith reflect its screens and code as of November 2026.
FAQ
Does every video get key moments?
No. The video must be 60 seconds or longer with 100 or more views, and only detected segments are highlighted.
What does the intro rate mean?
The share of viewers still watching after the first 30 seconds.
Is a spike a good sign?
It marks parts that were rewatched or shared, but viewers may also have rewatched because it was unclear, so check why.
Is the data instant?
Retention data usually takes 1 to 2 days to process.
Can I compare subscribers and non-subscribers?
Yes. Segments compare new and returning viewers, subscribers and non-subscribers, and organic and paid traffic.
Sources
- Measure key moments for audience retention — YouTube Help · checked
- 시청 지속 시간의 주요 순간 측정하기 (Korean) — YouTube Help · checked